Today I was having problems debugging a design in Chipscope and SDK. For some reason, every time I used the Chipscope trigger (either the armed trigger or immediate) the Microblaze would reset or jump to another part of the code. I figured that Chipscope was messing with the stack pointer but I couldn’t find anything in the forums for such a problem. I finally came across a solution here:
[14.6] SDK and Chipscope do not work together
The solution didn’t put any light on why the problem occurs, but it did fix my problem - many thanks to moderator htsvn. Here’s my clean and illustrated version of the solution:
- Connect the power supply and programming cables to the board.
- Launch SDK.
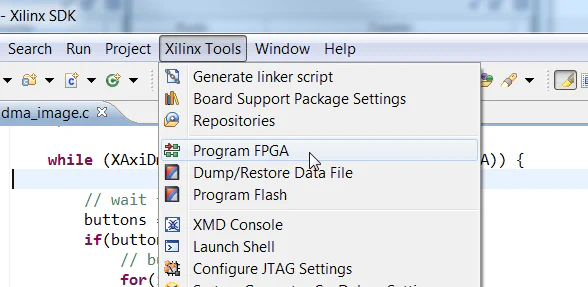
- Program the FPGA using SDK: “Xilinx Tools->Program FPGA”.
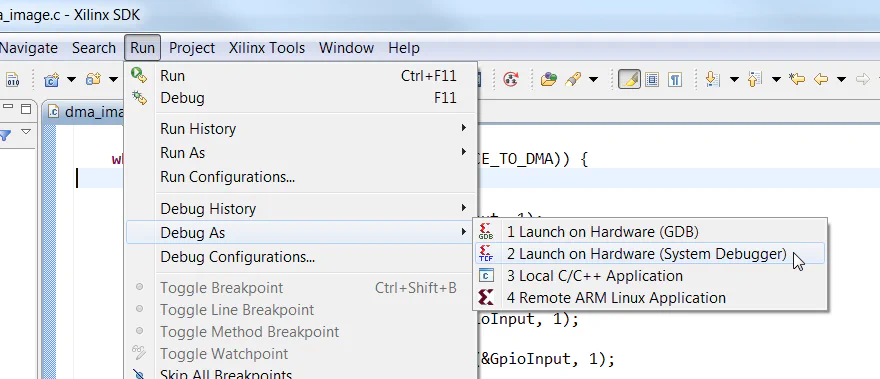
- In the SDK, from the menu, select “Run->Debug As->Launch on Hardware (System Debugger)” as shown. Alternatively, you can use “Run As” if you don’t need to debug the code.
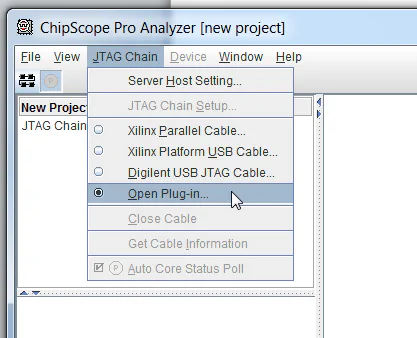
- Launch Chipscope Analyzer and select from the menu “JTAG Chain->Open plug-in”.
- Type in the following parameter and click OK:
xilinx_tcf URL =tcp::3121
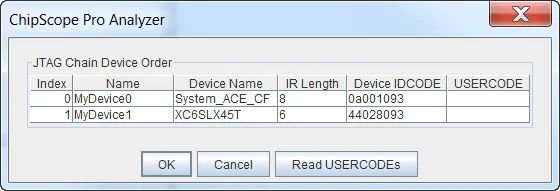
- This will detect the chain and you can see the devices on the chain.
- Import the CDC file using Chipscope Analyzer (or just open up a preconfigured Chipscope project file).
- Set the trigger points in Chipscope and click on Apply Settings and ARM trigger
- In the SDK Debug Perspective set the break-points in the C code and run through the code.